Monitor your Azure Kubernetes Cluster
Once you have your critical application running on a Kubernetes cluster, it is important to monitor its performance metrics in order to sustain stable operation.
Without enough visibility, you will never be able to identify resource bottlenecks or determine the maximum load that the cluster can sustain.
This article will only cover monitoring, not alerting. I might cover this in a following post.
I looked at two different approaches, specific to monitoring Azure Kubernetes Services workloads:
Enable Azure Monitor for Containers
Azure Monitor for Containers is based on Log Analytics Workspace, which integrates with the metrics provided by the Kubernetes cluster. Application and workload metrics are collected from Kubernetes nodes using queries and can be used to create custom alerts, dashboards, and detailed performance analysis.
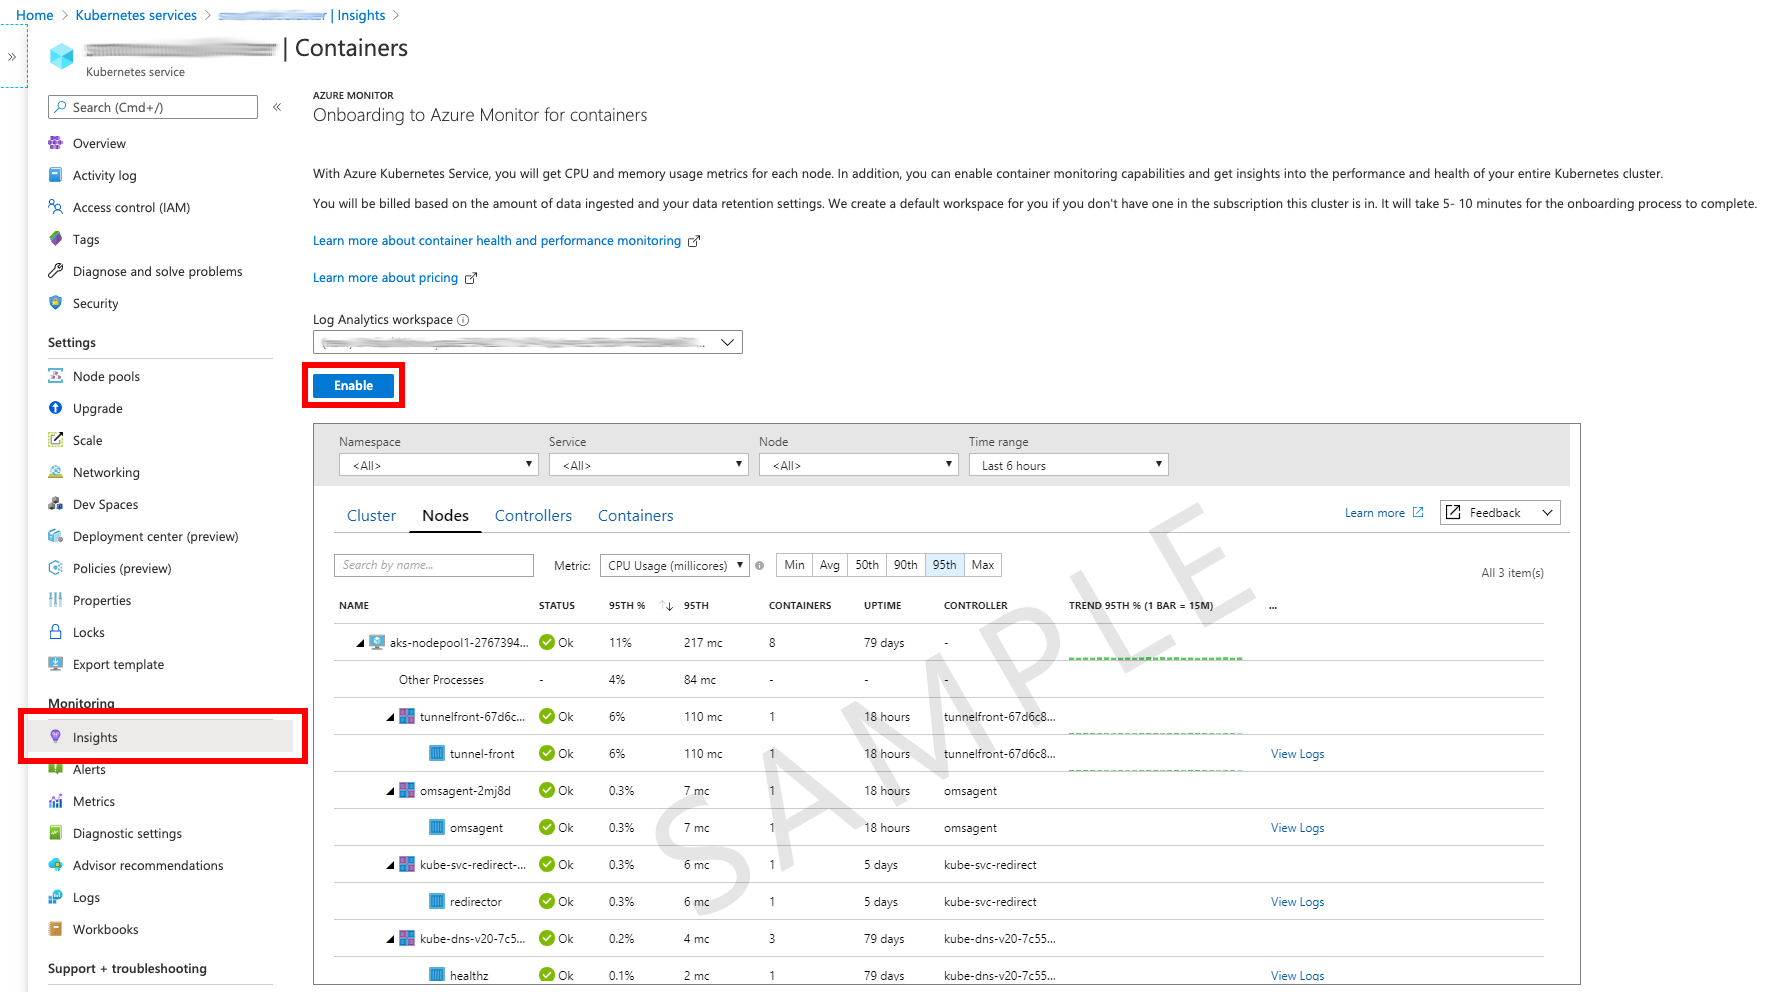
There are several ways to set up monitoring of your Kubernetes workload in Azure. The easiest is go to your cluster and enable Insights

This starts an onboarding process which will guide you through the necessary steps of creating a Log Analytics Workspace (on choosing an existing one) and then setting up Log Analytics to make additional metrics available to Azure Monitoring.
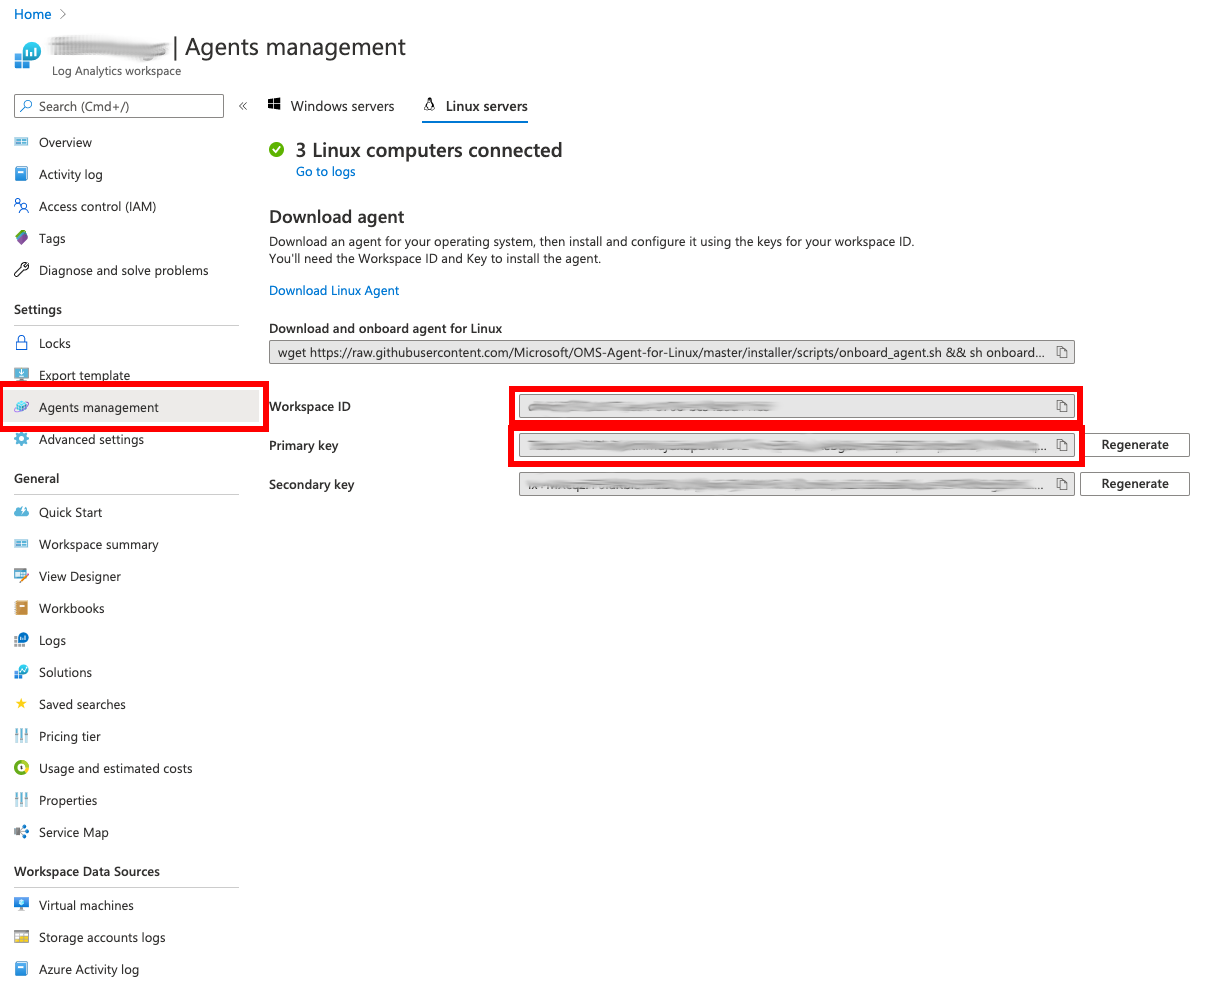
Before any data can be retrieved by Azure Monitoring, a Log Analytics Agent has to be deployed on the targeted cluster. The agent provides performance metrics via a metrics service running on the cluster. The instructions for deploying the agent can be found here for Linux and here for Windows respectively. If you therefore choose to deploy a Kubernetes DaemonSet without secrets, you will have to provide the Workspace ID and Key of your Log Analytics Workspace. You will find these credentials under Log Analytics Workspace → Agents Management

Once your Log Analytics Agent is up and running, performance metrics are available to your cluster Monitoring service.
Be aware that the Azure Monitoring might come with high cost, depending on the amount of data that is transferred. I recommend to check pricing first, before taking on this approach.
See also this blog post for more detailed instructions on how to configure Azure Monitoring.
Use the Kubernetes Dashboard
If you just need a simple overview dashboard for your Kubernetes cluster Performance, the Kubernetes Dashboard might come in handy. In contrast to Azure Monitoring, it is very convenient to use.
If using AKS, the metrics server and dashboard are already installed on every Kubernetes Cluster.
Otherwise, the installation process is described here. It basically boils down to executing the following command,
kubectl apply -f https://raw.githubusercontent.com/kubernetes/dashboard/v2.0.0/aio/deploy/recommended.yamlAfter successful installation, you will find the kubernetes-dashboard URL with the cluster-info command, i.e.
kubectl cluster-infoThe dashboard can be made available on your local machine via kubectl proxy.
The Kubernetes proxy will establish an authenticated connection to the cluster IP running on the Kubernetes cluster, so that you can access the dashboard with your web browser. The URL is obtained by replacing the cluster host name with the address of your local proxy (localhost:8001 by default).
With AKS, the dashboard is conveniently accessible by using the Azure-Cli browse command:
az aks browse --resource-group myResourceGroup --name myClusterAnd your dashboard loads right away inside your default browser.
Note that the Kubernetes dashboard currently supports resource metrics integration only via Heapster, which is currently being deprecated in favor of metrics server. Support for metrics api is being worked on as part of the next generation dashboard. Therefore the current dashboard does not provide any resource metrics over time.
An alternate resource monitoring pipeline for your Kubernetes cluster can be integrated with third party tools like Prometheus and Grafana, which is covered in the next section.
Install Prometheus and Grafana
Prometheus is probably the most popular third-party alternative to monitor your Kubernetes cluster. And in combination with Grafana, you will quickly have a powerful monitoring pipeline set up.
To install Prometheus, the most convenient way is using the Prometheus Operator Helm Chart. Helm is a package manager for Kubernetes. It simplifies the installation by integrating most of the necessary configuration settings into one package.
The following instructions are based on a blog post which describes the installation process specific for AKS clusters.
First, a local Helm values file is created, which contains several important settings to make Prometheus Operator working with your AKS cluster.
---
# Forcing Kubelet metrics scraping on http
kubelet:
    enabled: true
serviceMonitor:
    https: false
# Disabling scraping of Master Nodes Components
kubeControllerManager:
    enabled: false
kubeScheduler:
    enabled: false
kubeEtcd:
    enabled: false
kubeProxy:
    enabled: false
# Optional: Disable Grafana if you have your own deployment
grafana:
    enabled: false
Then, the Prometheus Operator is installed in the monitoring namespace.
# If using helm for the first time, add the stable repo
# helm repo add stable https://kubernetes-charts.storage.googleapis.com/

kubectl create namespace monitoring
helm upgrade --install prometheus --namespace monitoring stable/prometheus-operator --values values.yml
Check the status of the Prometheus Operator by running:
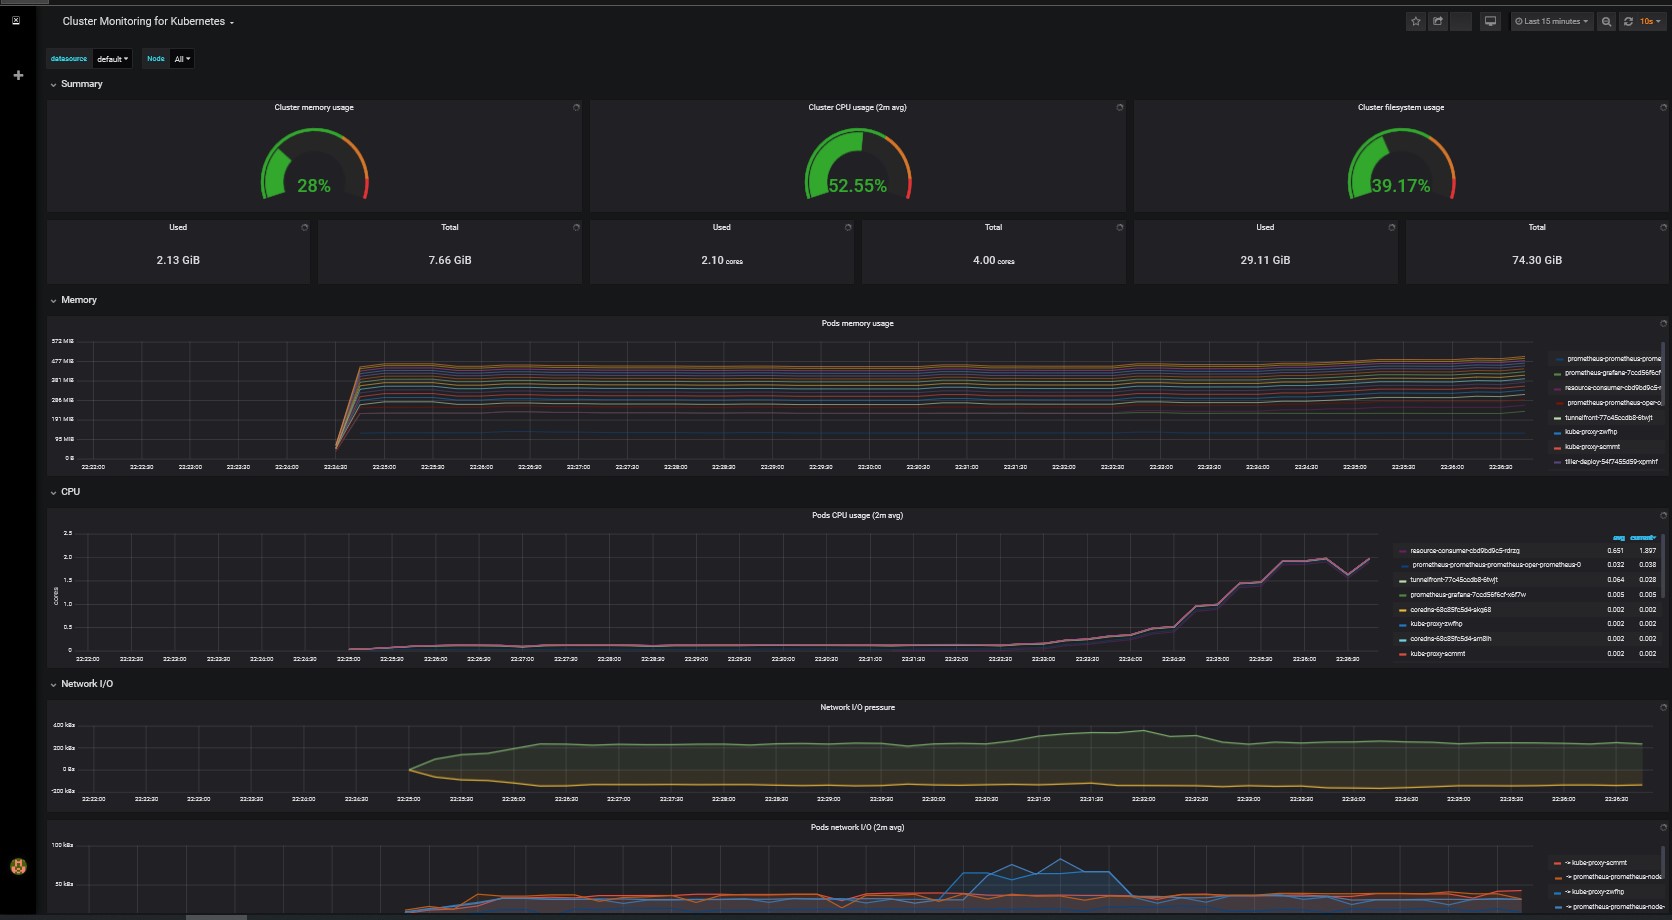
kubectl --namespace monitoring get podsIf everything works as expected, the metrics can be viewed with the Grafana dashboard. The Grafana container installed with the Prometheus Operator Chart can be accessed with kubectl port-forward.
The default credentials are user admin with password prom-operator. See this blog post for the details of launching the Grafana dashboards.
If you want to use your existing Grafana deployment, download an existing Kubernetes dashboard like
- https://grafana.com/grafana/dashboards/315
- https://grafana.com/grafana/dashboards/7249
- https://grafana.com/grafana/dashboards/3119
and configure the dashboards with a Prometheus Datasource pointing to http://prometheus-prometheus-oper-prometheus.monitoring:9090.

To uninstall the Prometheus Operator, carefully follow these instructions:
# Uninstall/delete the prometheus deployment:
helm delete --namespace monitoring prometheus

# CRDs created by this chart are not removed by default and should be manually cleaned up
kubectl delete crd prometheuses.monitoring.coreos.com
kubectl delete crd prometheusrules.monitoring.coreos.com
kubectl delete crd servicemonitors.monitoring.coreos.com
kubectl delete crd podmonitors.monitoring.coreos.com
kubectl delete crd alertmanagers.monitoring.coreos.com
kubectl delete crd thanosrulers.monitoring.coreos.com

# Finally, delete the namespace
kubectl delete namespace monitoring --cascade=true